Crash memory dump. Analyzing a memory dump or how to identify the cause of BSoD? Windows 10 crash dump
I will continue to talk about the blue screen of death, which I started in.
So, if the computer suddenly reboots or freezes, and the blue screen of death does not appear or appears for a split second, then information about the causes of the failure can still be restored.
The fact is that the operating system at the time of failure saves the contents of RAM in the so-called dump file(has extension .dmp). In the future, the dump file can be analyzed and get the same information as on the blue screen and even a little more.
But the creation of dumps can be disabled in the system, so you should make sure that, firstly, the system creates dumps when it crashes, and, secondly, you should know the location on the disk where they are saved.
To do this you need to go to the section System.
In Windows 10, this can be done through search, and in previous versions of the operating system through Control Panel.

Here, recording events in the system log should be enabled, but to prevent the computer from automatically rebooting and showing us the contents of the blue screen of death, you need to cancel the automatic reboot if it was enabled.
The path to the dumps is also displayed here - we see that the dump is saved in the %SystemRoot% folder - this is the designation of the Windows folder.
You can also select “small memory dump” here, which will be quite enough to search for error codes.
So, the system crashed into the blue screen of death, after which a memory dump was created.
There are special programs for analyzing dumps, and one of the most popular is the BlueScreenView utility.
The program is very easy to use and does not require installation - download from the official website and unzip it. At the same time, you can download a file from the official website with which you can Russify the program. To do this, this file will need to be placed in the folder with the unzipped program.
If, after launching the program, the dumps are not displayed, although the system crashed into the blue screen of death, then you should go to the program settings and make sure that the path to the memory dumps is correct, that is, it should be the same as in the system settings.

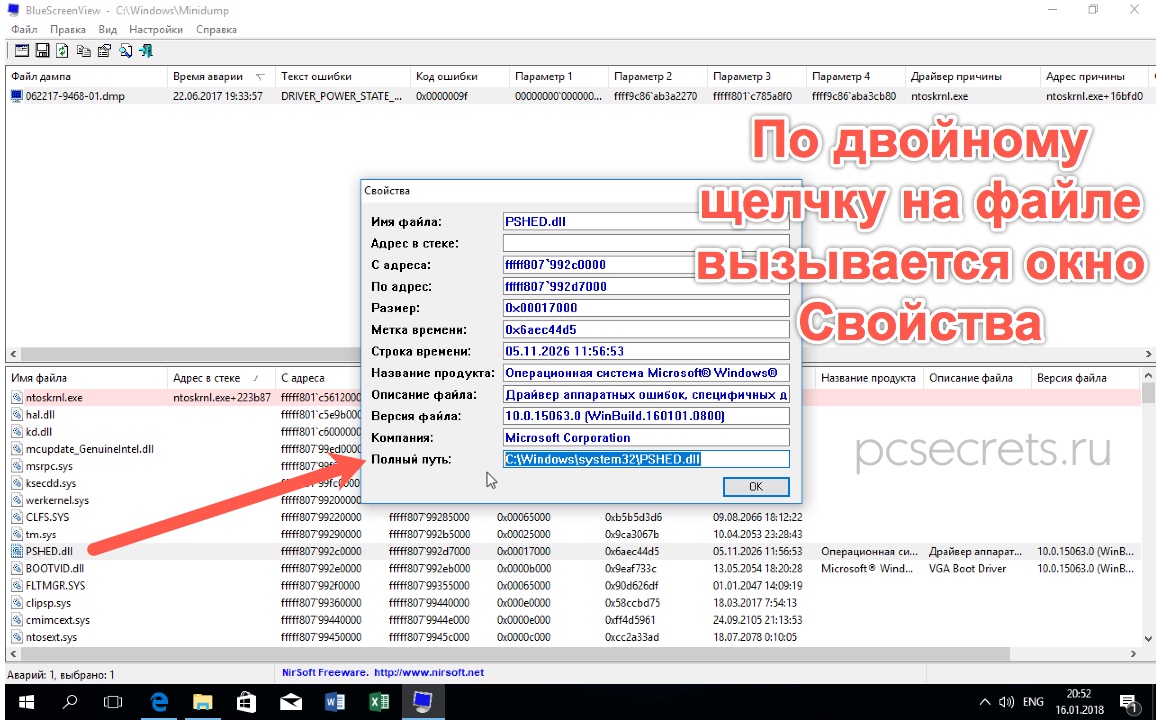
After this, you need to update the information in the program window and all dumps created in the system will be displayed. If there are several dumps, then we focus on the date of failure. Select the desired dump, and then detailed information about it will appear.
Here the name of the error is displayed, its STOP code with parameters, and if the cause was the driver, then in the corresponding field we will find its name.

Also, at the bottom of the program window, files that could also cause the failure will be highlighted in pink. We'll have to deal with each of them in order. The algorithm here is similar to that discussed in the previous post - we look for a solution on the Internet, and use the file name or error code as a search key.
In this case, it is not necessary to manually enter data into the search engine. If you right-click on the dump line, you can select an item from the context menu that will allow you to find a description of this particular problem in Google.

You can choose to search Google by error code, by error code and driver name, or by error code and parameter.
Also, using this utility, you can quickly find the location of the problematic file on the disk.
Sometimes it happens that the file that caused the problem belongs to some program or game. By the location of the file on the disk, you can quickly determine which program or game it belongs to.
Well, it’s worth knowing that cleaners seem to delete memory dumps, so if you use such programs, then you should refrain from using them while identifying the cause of the blue screen of death.
And the last question that I will answer as part of this note is what to do if after the blue screen appears the computer no longer starts? That is, the computer freezes or is constantly overloaded, which means there is no way to analyze the memory dump.
The answer is logical and simple - you need to create a bootable USB flash drive, with which you can “pull” the dump file from your hard drive and analyze it on another computer. To do this, boot from a flash drive and on the computer’s hard drive in the folder Windows or in a subfolder minidump We find the dump file, which we copy to the flash drive. Then on another computer using the utility BlueScreenView We analyze the dump, as described in this note.

If the so-called blue screen of death in Windows 10 appears in front of you and you are ready to fall into a nervous coma, pull yourself together and try to solve the problem. To begin with, it’s worth saying that this ominous message signals you about a critical system error. Moreover, it is not always possible to catch the moment and have time to read the error code when Windows falls into the blue screen of death and the device reboots. Let us immediately note that there are a huge number of solutions to this problem, as well as the reasons for the appearance of a blue screen. In this article we will try to consider the probable causes of the blue screen of happiness, as well as possible solutions to the problem.
In the vast majority of cases, the blue screen of death signals the error BAD_POOL_CALLER - stop 0x000000c2. To put it bluntly, it is difficult to diagnose this error, but perhaps we will try to use this error as an example to describe the algorithm for your next actions.
To properly diagnose the problem, you should first analyze a special system file called minidump. The creation of such files is caused by a system failure; moreover, they can inform us what exactly led to the failure.
1. To enable this automatic recording of a small memory dump (disabled by default), go to the computer properties and go to the "Advanced system settings" section (this enablement is provided for all systems, not just Windows 10):


As a rule, all minidump files are saved when a blue screen of death (BSOD) appears, and you can find them in the C:\Windows\Minidump folder. It is noteworthy that the file name contains the current date - when it was created, which makes it much easier to identify the date the error occurred, especially considering that there may be more than one such file.
Two ways to decrypt a small memory minidump
First way, consists of using the fairly popular BlueScreenView utility. This utility can also be a good option for analyzing a memory dump. The use of this utility will come in handy as a way to identify the problematic driver.

Moreover, it is especially notable for the fact that with its help it is possible to view the BSOD (blue screen of death) as if in a freeze frame, as it was when the system crashed. It displays the time and date of the failure, information about the driver or module with the version and a brief description. In addition, the utility is available in many languages, including Russian. So the BlueScreenView utility is just the thing if you need to quickly analyze memory dumps during BSOD.
For second method you need to install Debugging Tools for Windows and also download the bsdos_utility utility. Next, after unpacking the bsdos_utility.cmd script, you should move it to the C:\ drive (you can create a separate folder, but it is worth remembering that the script launch address line will be different from our example). Then on the command line you should write:
C:\bsdos_utility.cmd
After displaying a list of all dumps from the list C:\Windows\Minidump\, after which the script will ask which dump should be analyzed. You can also select the required minidump yourself when running the script:

In a similar way, it is possible to detect a lot of Windows 10 errors that caused a BSOD, as well as problematic .exe programs that caused a blue screen.
Good afternoon, dear colleagues and readers of the blog site. Today I want to tell you how to analyze a Windows 10 Redstone memory dump. This is done in most cases when you get a blue screen of death with an error, after which your computer reboots. And this analysis helps to understand the cause of the failure.
Setting up a Windows 10 memory dump
So, what is a memory dump in the Windows 10 Redstone operating system. Above, I described to you a very common reason why a system memory dump appears and these are blue screens of death. The reasons for their appearance are very extensive:
- Application incompatibility
- Driver incompatibility
- New Windows updates
- Devices are not compatible
This is just a small generalized list, since there are a whole lot of error codes from blue screens, I will give the most recent ones.
Our task is to be able to find these files for diagnostics and be able to interpret them to obtain information about the problem.
Where to configure a Windows 10 crash dump
First, let's figure out where the setting is made that is responsible for the Windows 10 crash memory dump. Right-click on the Windows 10 start button and select System from the context menu.

In the System window that opens, in the upper left corner, select Advanced System Settings.

This is where the Windows 10 memory dump is configured. Click on the Settings item in Boot and Recovery.

From the settings of the Windows 10 memory dump, I would like to note the following:
- Recording an event in the system log > here information about the blue screen will be added to the operating system logs.
- Perform an automatic reboot > to continue working after an error
- Recording debugging information > allows you to select the type of dump file, more on that below.
- Replace an existing dump file, a useful checkbox, since these dumps can weigh tens of gigabytes, which is very critical for small SSD drives.

Types of memory dumps
Let's look at the differences between the options for recording debugging information
- Small Memory Dump 256 KB: Small memory dump files contain the following information:
– message about a fatal error, its parameters and other data;
– list of loaded drivers;
– processor context ( PRCB) on which the failure occurred;
EPROCESS) for the process that caused the error;
– process information and kernel context ( ETHREAD) for the thread that caused the error;
– Kernel mode call stack for the thread that caused the error.
It is used when you have very little disk space on your local drive. Due to this, we sacrifice useful information, which may not be enough to diagnose a blue screen.
The mini dump is stored in the path C:\Windows\Minidump
- Kernel memory dump > records only kernel memory. Depending on the amount of physical memory of the PC in this case, the paging file requires from 50 to 800 MB or one third of the computer's physical memory on the boot volume.
- Full memory dump > well, everything is clear from the name. It writes absolutely everything, this is the maximum information about the blue screen, it gives a one hundred percent diagnosis of the problem.
Located at C:\Windows\Memory.dmp
- Active memory dump > the active memory of the host machine gets here, this function is more for server platforms, since they can be used for virtualization, and so that information about virtual machines does not get into the dump, this option was invented.
Errors very often occur in Windows OS, even in the case of a “clean” system. If ordinary program errors can be solved (a message about a missing component appears), then critical errors will be much more difficult to fix.
What is a memory dump in Windows
To solve problems with the system, a crash memory dump is usually used - this is a photo part or all of the RAM and placing it on a non-volatile medium (hard drive). In other words, the contents of RAM are fully or partially copied to the media, and the user can analyze the memory dump.
There are several types of memory dumps:
Small dump(Small Memory Dump) – saves a minimum amount of RAM, which contains information on critical errors (BSoD) and components that were loaded during system operation, for example, drivers, programs. MiniDump is stored in the path C:\Windows\Minidump.
Full dump(Complete Memory Dump) – the full amount of RAM is saved. This means that the file size will be equal to the amount of RAM. If there is little disk space, it will be problematic to save, for example, 32 GB. There are also problems with creating a memory dump file larger than 4 GB. This type is used very rarely. Stored at C:\Windows\MEMORY.DMP.
Dump kernel memory– only information related to the system core is saved.
When the user gets to analyzing the error, he only needs to use minidamp (small dump). But before this, it must be turned on, otherwise the problem will not be recognized. Also, to more effectively identify a crash, using a full memory snapshot is preferable.
Information in the registry
If you look in the Windows registry, you can find some useful snapshot settings. Click the Win+R key combination and enter the command regedit and open the following branches:
HKEY_LOCAL_MACHINE\SYSTEM\CurrentControlSet\Control\CrashControl
In this branch the user will find the following parameters:
- AutoReboot– enable or disable reboot after creating a blue screen of death (BSoD).
- DumpFile– name of dump types and location.
- CrashDumpEnabled– the number of the file being created, for example, the number 0 – the dump is not created; 1 – creating a full dump; 2 – creating a core dump; 3 – creating a small dump.
- DumpFilters– the option allows you to add new functions before creating a snapshot. For example, file encryption.
- MinidumpDir– the name of the small dump and its location.
- LogEvent– activation of recording information in the system log.
- MinidumpsCount– set the number of small dumps to be created. (Exceeding this number will destroy old files and replace them).
- Overwrite– function for a full or system dump. When creating a new photo, the previous one will always be replaced with a new one.
- DedicatedDumpFile– creating an alternative image file and specifying its path.
- IgnorePagefileSize– used for temporary snapshot location, without using a swap file.
How does this work
If a failure occurs, the system completely stops its operation and, if dumping is active, it will be written to a file placed on disk. information about the problem that has arisen. If something happened to the physical components, then an emergency code will work, and the hardware that failed will make some changes, which will certainly be reflected in the snapshot.
Usually the file is saved in a hard disk block allocated for the paging file; after a BSoD appears, the file is overwritten in the type that the user himself configured (Small, full or core dump). Although, in modern operating systems, the participation of the paging file is not necessary.
How to enable dumps
IN Windows 7:
IN Windows 8 and 10:
Here the process is a little similar, you can get into the system information in the same way as in Windows 7. In “Ten”, be sure to open “ This computer", click on the free space with the right mouse button and select " Properties" Another way to get there is through the Control Panel.
Second option for Windows 10:

It should be noted that in new versions of Windows 10, new items have appeared that were not in the “seven”:
- Small dump memory 256 KB - minimum failure data.
- Active dump- appeared in the tenth version of the system and saves only the active memory of the computer, the system kernel and the user. Recommended for use on servers.
How to delete a dump
Just go to the directory where the memory snapshots are stored and simply delete them. But there is another way to remove it - using the Disk Cleanup utility:

If no items were found, the dumps may not have been enabled.
Even if you once enabled them, some system optimization utilities you use can easily disable some functionality. Often a lot of things get disabled when using SSD drives, since repeated reading and writing procedures greatly harm the health of the drive.
Memory dump analysis using WinDbg
Download this program from the official Microsoft website in step 2, where it is described “ InstallationWDK" - https://docs.microsoft.com/en-us/windows-hardware/drivers/download-the-wdk. 
To work with the program you will also need a special package of debugging symbols. It's called Debugging Symbols, previously it could be downloaded from the Microsoft website, but now they have abandoned this idea and you will have to use the File program function - “ Symbol File Path", where you should enter the following line and click OK:
set _NT_SYMBOL_PATH=srv*DownstreamStore*https://msdl.microsoft.com/download/symbols
If it doesn't work, try this command:
SRV*%systemroot%\symbols*http://msdl.microsoft.com/download/symbols
Click “File” again and select the “Save Workspace” option.
The utility is configured. All that remains is to specify the path to the memory dump files. To do this, click File and click the option “ OpenCrashDump" The location of all dumps is indicated at the beginning of the article.
After selection, the analysis will end and the problematic component will be automatically highlighted. To obtain more information in the same window, you can enter the following command: !analyze –v 
Analysis with BlueScreenView
You can download the tool for free from this site - http://www.nirsoft.net/utils/blue_screen_view.html. Installation does not require any skills. Only used on Windows 7 and higher.
We launch and configure. Click “Options” – “ Additional options"(Advanced Options). Select the first item " Load MiniDumps from this folder"and indicate the directory - C:\WINDOWS\Minidump. Although you can simply click the “Default” button. Click OK.
The dump files should appear in the main window. It can be either one or several. To open it, just click on it with the mouse. 
The bottom of the window will display the components that were running at the time of the failure. The person responsible for the accident will be highlighted in red.
Now click “File” and select, for example, the item “ Find in Google error code + driver" If you find the driver you need, install and restart your computer. Perhaps the error will disappear.
Windows is a very fragile creation and just about any wrong action on the part of the user will lead to critical errors, and not very good ones. Information written on the screen itself, as well as special memory dump files that save data about the causes of BsoD, help you find out information about blue screens of death, which are the very critical problems. I strongly recommend enabling this feature, since no one is immune from blue screens, even an experienced user.
The memory dumps themselves are usually stored in the path C:\Windows\MEMORY.DMP, or C:\Windows\Minidump - where the so-called small memory dumps are stored. By the way, a small memory dump will be the file that will help you find out the cause of BsoD.
Typically, the creation of memory dumps in Windows 10 is disabled by default, which means that using special utilities to check dump files will not give a positive result. Let's get straight to action.
How to enable the memory dump function on Windows 10 and configure it
Typically, utilities like BlueScreenView are used to view dumps, but you need to set up automatic creation of memory dumps right now, otherwise this program and similar ones will be useless.
A window will open, where on the left side click on the option “ Advanced System Settings».
In the " Additionally"Press the point "".
Finally, a window opens where the main parameters for configuring dumps are located. Here you can see that an automatic memory dump is activated in Windows, which is stored in the path indicated just below. The checkboxes for creating logs are also included. In addition, small memory dump files are also created, which will be very useful to us when working with blue screens of death. Information on the system core and memory is also saved. If the mode is automatic, then this will be enough.
Information about other memory dumps
If you open the drop-down menu for recording debugging information, you will see several options that I will describe below.
- Small memory dump– a mini dump, which is saved along a special path and weighs 256 Kilobytes. This file stores basic information on blue screens of death and system processes. If you need to find out the cause of the BSOD, then a small memory dump is enough. BlueScreenView or similar programs are used to retrieve information. Any beginner can use this method.
- Kernel memory dump– the file will contain the same information as the automatic type. The only difference is that the system changes the paging file. Which option should I choose? I think it's an automatic type.
- Full memory dump– the file contains complete data about RAM, which means the file size will be equal to the size of the RAM. You have 8 GB on your PC, which is how much the full memory dump file will occupy on disk. This option is not particularly suitable for beginners.
- Active memory dump– first appeared in Windows 10. More suitable for servers and stores data about active memory and kernel modes, as well as the current user.
How to delete a memory dump file
It’s very simple, you go along the path where these files are located and manually delete them. For example, the full memory dump file is called MEMORY.DMP, just delete it and that's it. When using the Disk Cleanup tool, there is also an option to delete dump files.

Memory dump may be disabled due to system cleaning utilities. When using SSDs and special utilities for working with these drives, they can also disable some system functions so that the SSD is less subject to read/write procedures.